2017 NAEP Shows Gains in 3 of 4 Areas
But More Work To Do
Welcome back! As we all get back into our normal school schedules and activities, assessment results for the “Nation’s Report Card” were released. In short, there is some encouraging news about our student performance in reading and math in 4th and 8th grades.
The results of the 2017 National Assessment of Educational Progress (NAEP) released by the U.S. Department of Education show that Atlanta Public Schools (APS) is maintaining steady overall growth. When compared to the 2015 NAEP results, the average scale score and percent of students scoring proficient and above increased in 4th grade reading and math and 8th grade reading.
It is a positive trend and can be viewed as an indication that the investments we’re making in the early grades (PreK-3), particularly in our literacy initiatives, are having a positive impact on student performance. We know that effective and high-quality early learning experiences have been shown in repeated studies to have long-lasting impacts on our students.
APS participates in the NAEP assessment as a part of a special assessment group of 27 school districts in large metropolitan areas, called a TUDA (Trial Urban District Assessment). By participating in NAEP as the only TUDA district in Georgia, APS can receive district-level aggregated scores which are comparable to other TUDA districts, to the state of Georgia, and to public schools in large cities. (NOTE: Results are not reported for individual students or schools. Additional information about NAEP and APS’ district-level snapshots can be found here: 4th grade reading; 4th grade math; 8th grade reading; 8th grade math.)
We are proud to be the only district participating in TUDA in Georgia, and although NAEP is focused on key performance data across 4th and 8th grades, we continue to focus more broadly on the whole child — understanding the impacts of socio-economics on student performance — to ensure that all of our students, and especially our African-American and Hispanic students, are performing well on these assessments.
As some of you know, NAEP is the largest nationally representative and continuing assessment of what America’s students know and can do in various subject areas. Every two years, NAEP samples students in 4th and 8th grade and assesses them in reading and math. Other subjects (science and writing) vary from year to year. In 2017, 1,300 APS students participated in NAEP.
As part of determining student performance, achievement levels are broken down into four categories:
- Below Basic
- Basic denotes partial mastery of prerequisite knowledge and skills that are fundamental for proficient work at grade.
- Proficient represents solid academic performance for each grade assessed. Students reaching this level have demonstrated competency over challenging subject matter, including subject-matter knowledge, application of such knowledge to real-world situations, and analytic skills appropriate to the subject matter.
- Advanced represents superior performance.
(NOTE: These achievement levels DO NOT represent proficiency as defined by the Georgia Milestones Assessments.)
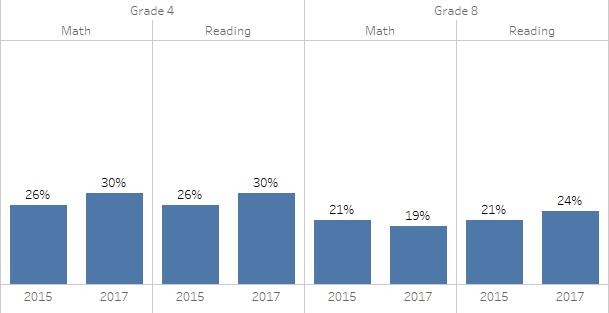
In this chart below, you can see the percentage of students scoring proficient and above increased by four percentage points in 4th grade math and reading, and by three percentage points in 8th grade reading. The numbers dipped slightly in 8th grade math, going from 21% to 19%.
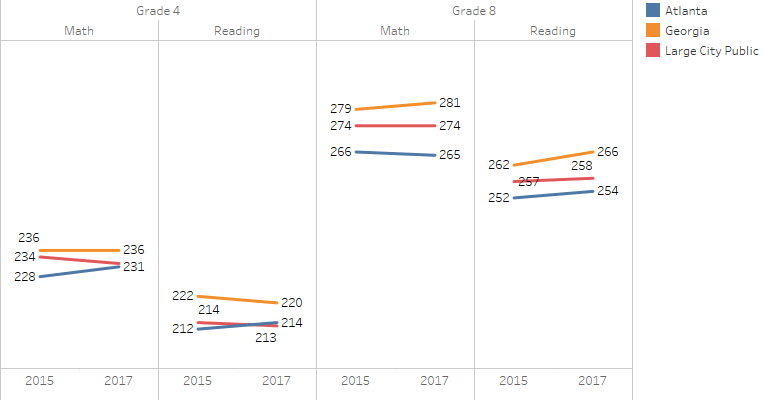
This next chart (below) shows that in terms of scale scores on the 2017 NAEP, APS nearly closed the gap with public schools in large cities nationwide in 4th grade math and was higher than large cities in 4th grade reading.
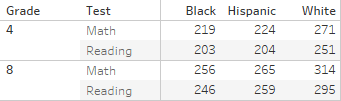
Although the overall results are encouraging, we must continue to focus on closing the achievement gap that exists between our White students and their African-American and Hispanic peers. This table (below) shows that achievement gap in our school district through the lens of the 2017 NAEP average scale score by race or ethnicity. The performance gaps are not different from previous years and are similar to those seen on the Georgia Milestones.
NAEP is one indicator of how our 4th grade and 8th grade students perform at a certain point in time in comparison to their national and statewide peers. We will continue to use these scores, our Georgia Milestone, and other assessments to ensure we not only know how our students are performing, but that we put strategies in place to continue to improve student performance.
We’re on a journey; we know we still have a ways to go, but APS is moving forward! I am very proud of the work that our teachers and administrators are doing to improve the academic achievement levels of our students.
#MovingForward #NAEP2017
Blog Signup